Written by Seth Dingle, edited by Moritz Seibert
As bitcoin makes a run at it’s all time high, the bitcoin maximalists are out in force on social media preaching the gospel about how “digital gold” will soon be taking over the fiat world, and how you should be selling everything you own to “stack Sats.”
HODLing is easy to preach, but much harder to do, especially if a significant amount of personal wealth is at risk. The movements both higher and lower in bitcoin since its creation in 2009 have been nausea-inducing to say the least. However, systematic trading can be a tool that helps deal with manic markets. By automating the entry and exit signals and sizing positions using their volatility, a trader can sleep better at night while still participating in the “fun.” Granted, no trading system is going to look as good as the the PL of the person who claims to have been HODLing since the early days of bitcoin, but we can’t go back in time anyway. What we can do is set a plan in place now to trade bitcoin in a way that helps constrain losses but also allows us to participate in the big runs, both higher AND LOWER!
Chances are you are already familiar with trend following if you are a fan of the Two Quants. A trend following approach aims to identify when a price trend is likely in place, take a position, and then ride it until the trend has ended. Trend followers are always late to the party and tend to overstay their welcome. Recently, in my own trading research I have been testing within a framework I call “Excursion Analysis” which is based on the work of John Sweeney from his book Campaign Trading. I’ve been documenting the process on my YouTube channel “Systematic Trading Journal.” Let’s take a look and see how trading bitcoin using the systems I’ve been working on would have done over the past decade.
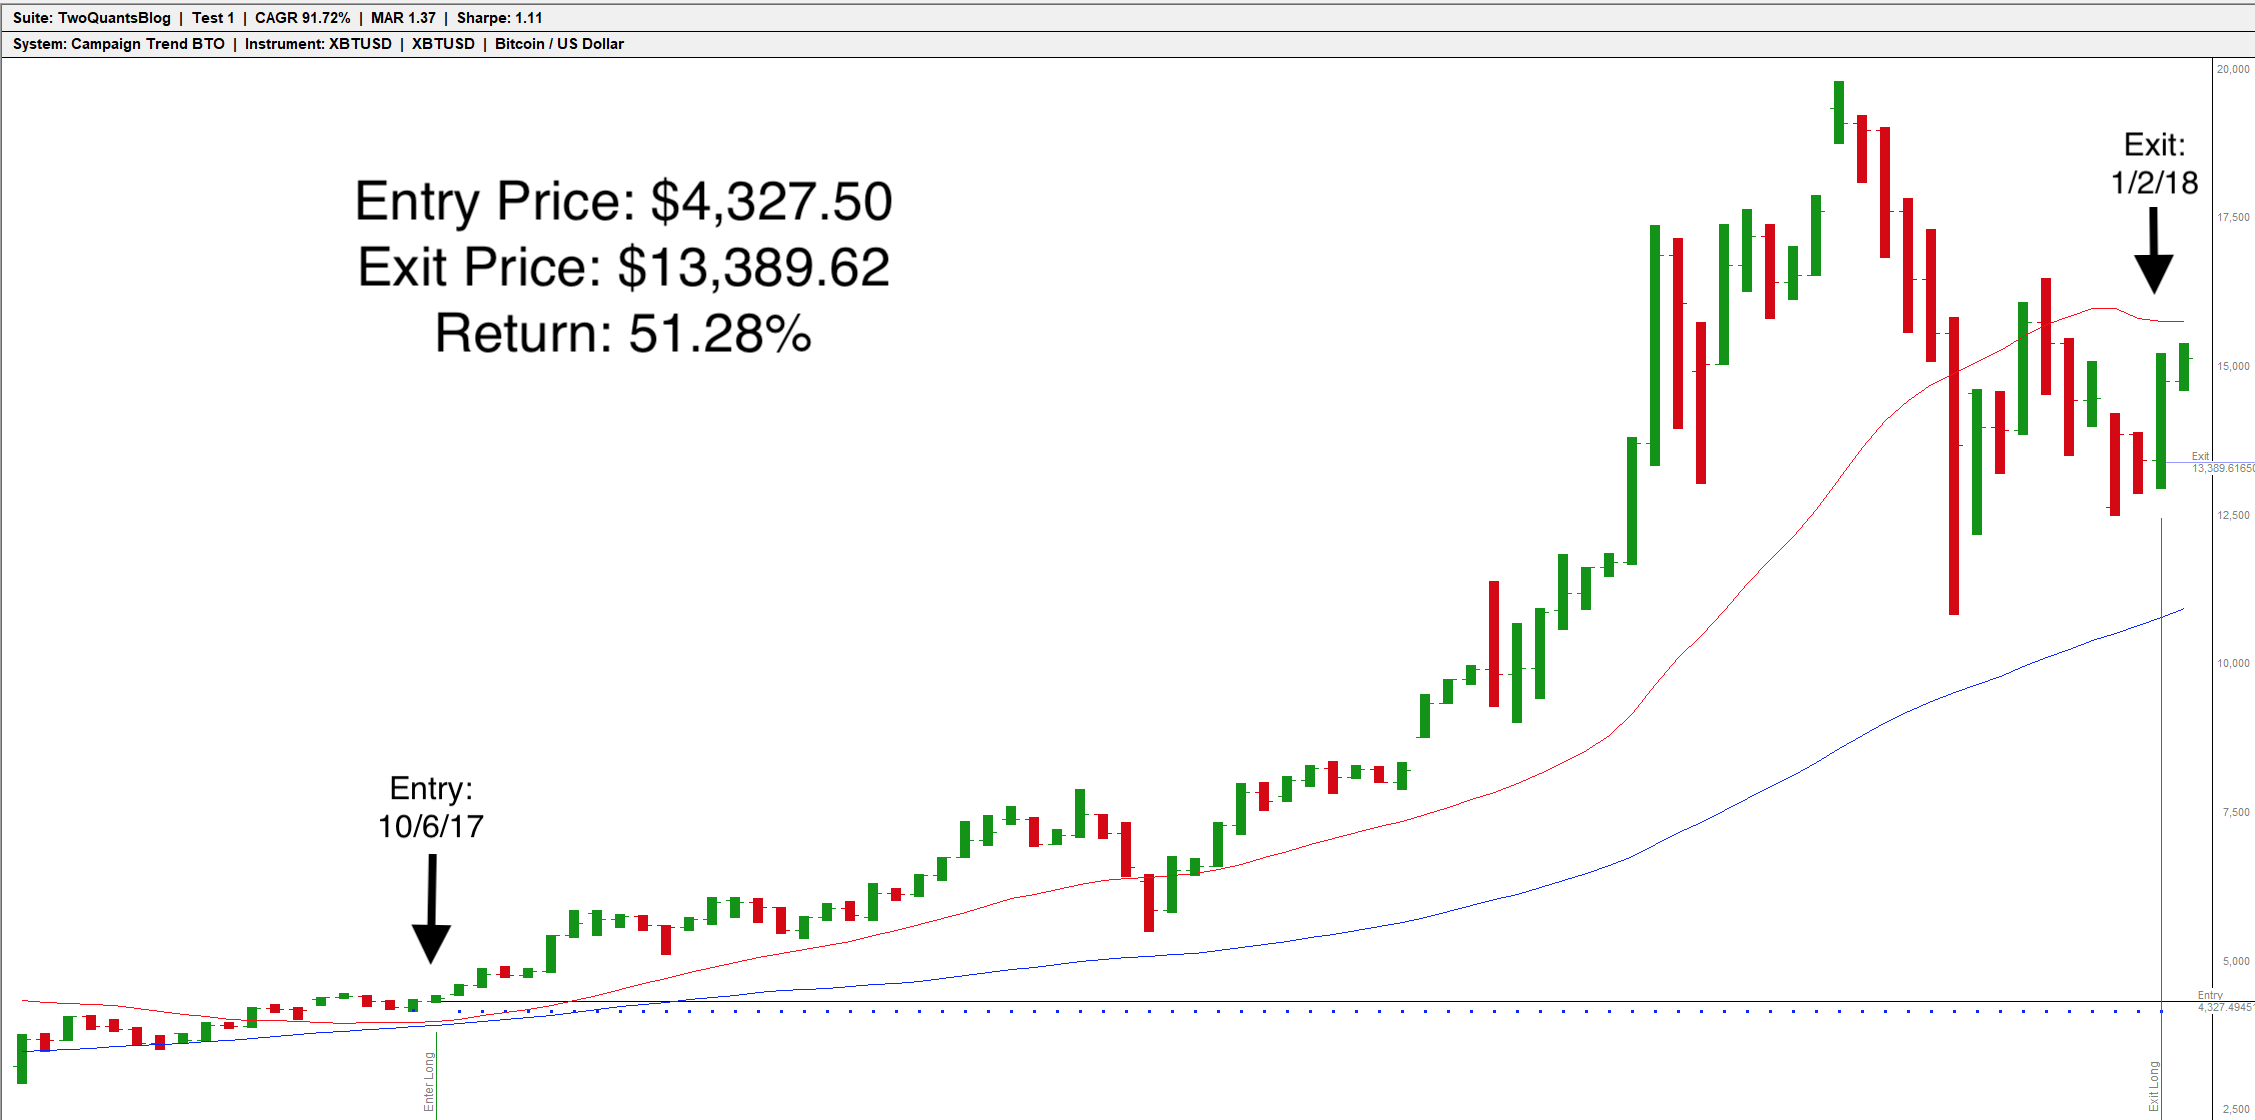
System 1 is a pure trend following system detailed here. It utilizes two simple moving averages. If both moving averages are moving up, a long position is taken, if both averages are moving down, a short position is taken, if the averages are moving in different directions, the system is flat. To minimize the chances of overfitting, I used some commonly found units of time as look-backs for the moving averages (weekly, monthly, quarterly, and yearly). For these examples, we will use the monthly and quarterly timeframes for the averages. Here is a long trade in 2017 when bitcoin made its prior all-time high.

You can see after a short consolidation in September, the price begins to move higher bringing the monthly moving average along with it. Once the monthly average turns higher on October 5th, the system goes long the next day and stays long until the price falls enough to cause the monthly moving average to roll over on January 1st, 2018.
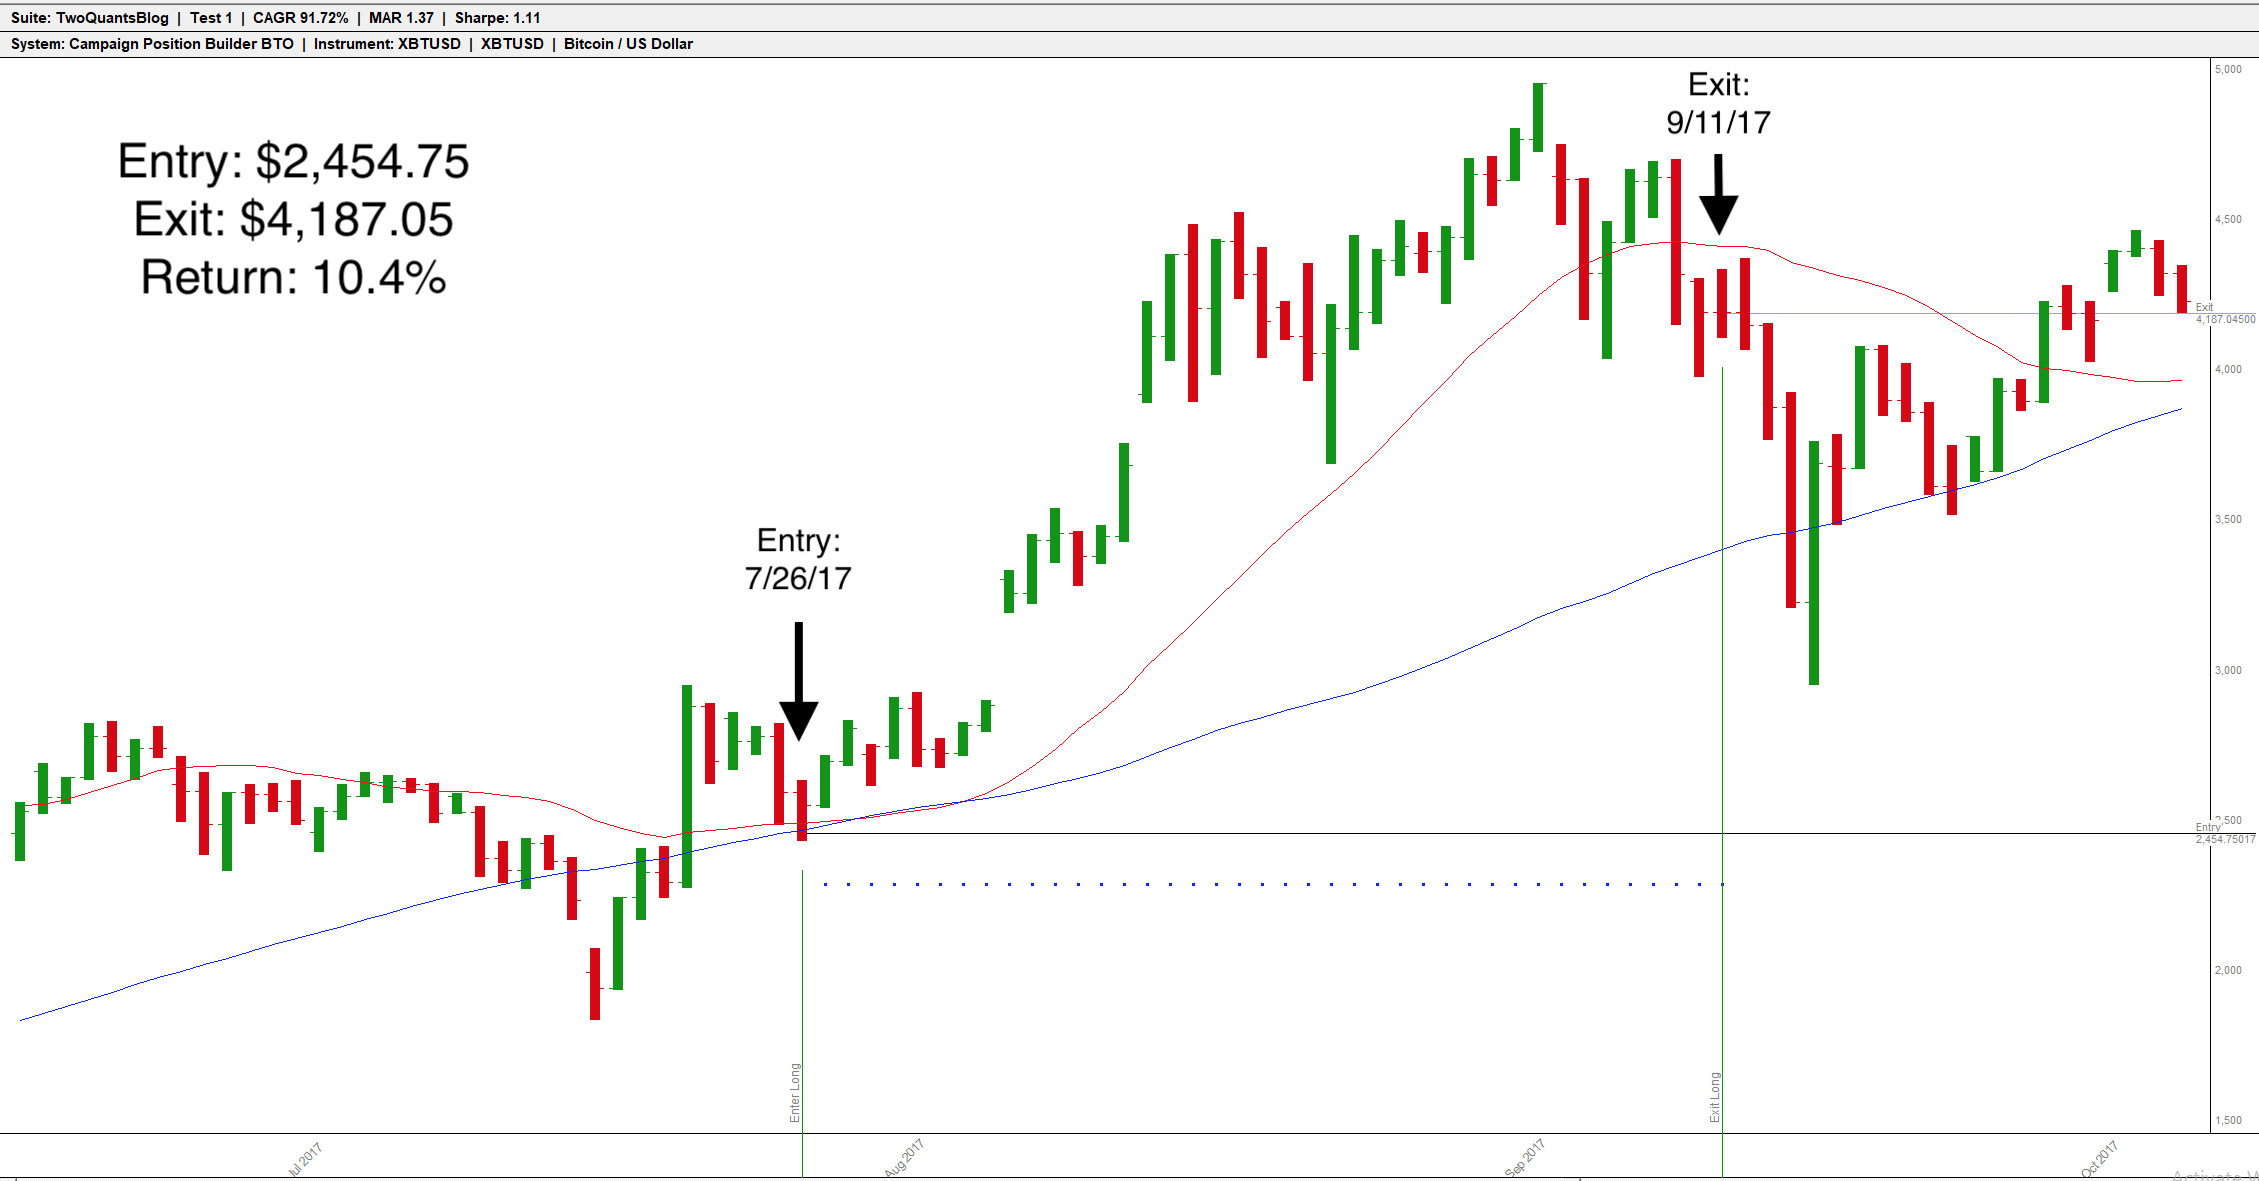
System 2 is a position builder strategy detailed here. It follows the same two moving averages but instead of entering as soon as the moving averages agree, it instead waits for price to pullback to the longer moving average. The aim here is to add to the core position on a pullback in the hope the short-term trend will resume.

While the position builder missed the Q4 rally to the all-time high in 2017 it did catch a nice chunk earlier in Q3 as seen here. After the short moving average turned up, the price touched the long average and an additional position was added on July 26th and held until September 11th .
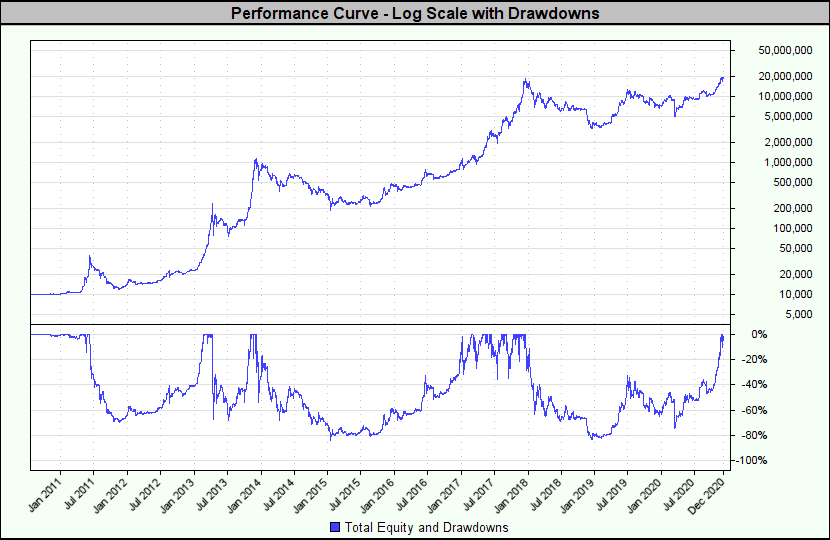
It’s difficult to compare a system that trades in and out with a simple buy and hold strategy on an asset that has grown exponentially like bitcoin but let’s give it a try anyway. Say you and Satoshi Nakamoto were buddies back in 2009 and you knew he was a smart guy so you decided to buy some of the digital money he wouldn’t stop talking about every time you got together for a beer. You finally gave in on September 9th, 2009 and PayPal-ed him $60.00 and he sent you 1,000 Bitcoin. As of today, December 7, 2020 you are a millionaire many times over. Your $60 investment has grown to over $19m. Easy, right? Well, no, not at all.
If you had actually bought and held bitcoin over this time period, you would have experienced four major peak-to-trough drawdowns: two around 60% and two around 80%. You would have spent 1,919 days in a drawdown of more than 50%. In late 2013, you would have become a millionaire only to watch it dwindle away to less than $200k over the next two years. Then, you wouldn’t see the million-dollar mark again until January 2017.
Do you really think those kind of account swings are manageable? It’s easy to SAY you could hang on since you were playing with the house’s money, but you can’t tell me you wouldn’t have been tempted to sell out somewhere on the way up or bail out during one of those particularly volatile drawdowns.

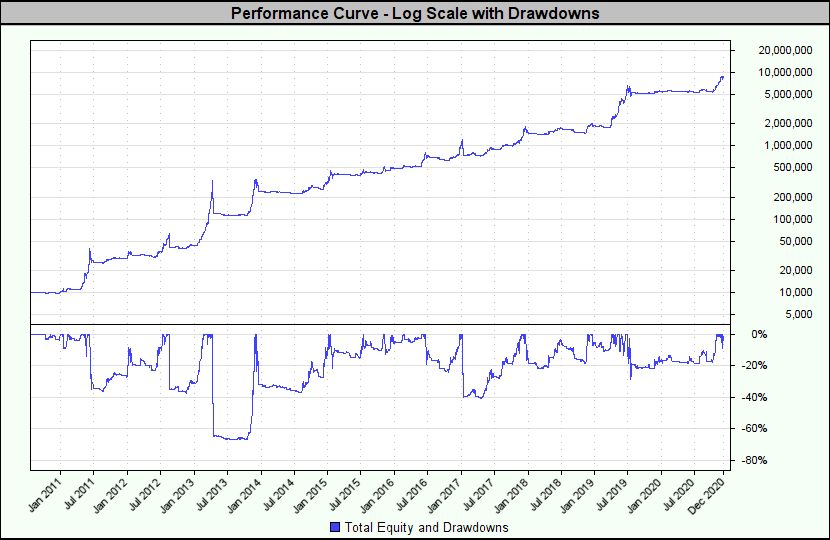
Now, let’s compare a combination of System 1 & 2 using the same metrics. These returns are based on $10,000 beginning equity and risking 1% of equity per trade. This combo isn’t without some serious drawdowns as well, but they are much less severe. Only one drawdown was greater than 40% (67%) and the majority of drawdowns were shorter in duration. Days spent in a drawdown greater than 50%: 213. Note that while buy-and-hold was in a 3-year drawdown from 2014 until 2017, this combo made eight new highs in the same period of time. You would not have reached the $1m mark until January 2017, getting there the same time buy-and-hold strategy recovered from its 80% drawdown. In this case, the ride was much smoother. Does smoother equal EASY? No, not at all. But is it EASIER? I think so.

Recall, we are also taking short trades in the combined trading system, so not only does the system get out when the trend turns down, it will also go short when the conditions are right. While the short side profits have been very small up to this point, they are still there which helps. It should be noted shorting would have been very difficult, if not impossible before the advent of bitcoin futures. Now however, it is very easy to do (and currently benefitting from the rich funding basis implied in the futures price).
Could these systems be optimized specifically to trade bitcoin with better results? Certainly, they could. The moving average parameters were selected for their commonality rather than being tuned to the specific price action in bitcoin. The initial stop loss was determined for both systems using the “Excursion Analysis” framework over a 30-year period using a diversified set of futures markets (not including bitcoin). Is trading bitcoin via systematic strategies that help limit loss and dampen account volatility when a significant amount of money is on the line more plausible than HODLing? I think so.
Still, might it be a good idea to stash a small percentage of your liquid net worth in physical bitcoin in a cold storage wallet and forget you own it for a few years? I think so. Might it be a good idea to “stack Sats” when you have some extra soon-to-be-worthless fiat currency lying around? Sure. I have done and will continue to do both, but I will also be actively trading bitcoin in my diversified trend following systems looking to take advantage of the moves higher and lower as they come!
Editor’s note: I know Seth from his participation in the “Top Traders Live Trading Weekend” in New York in October 2019. Seth is a big fan of trend following trading strategies and really understands this way of trading. In fact, he trades his own money using a trend following approach. He mostly uses a software called Trading Blox to develop and test his systems – a software which I also came around to using and which the Two Quants can recommend. Seth has an interesting YouTube channel, the “Systematic Trading Journal,” which you can find here. I really recommend you check it out and subscribe. Should you wish to contact the author directly, his email address is seth.dingle@icloud.com.


