It’s really easy to misplace things. Sometimes it happens due to lack of attention, sometimes it’s a medical condition. Every year, the second Friday of December is celebrated as Official Lost and Found Day. If you have lost something, it’s good practice to track it down swiftly. You head to the last place you remember that you clearly were in possesion of the item… or person, in case you forgot to pick up your child from piano lessons because you already downed the third glass of wine with the neighbours.
This week Wirecard, a Germany based payments and cards platform company, lost some cash. Wirecard was the FinTech posterchild of the German DAX 30 index. The company has been making negative headlines since March 2019, when it was accused of questionable accounting practices by the Financial Times. This week it became clear that €1.9bn went missing after Wirecard has been under special audit after they brought in KPMG to clarify the FT claims and review their 2016-18 books. The stock dipped by -63%. Clearly, if you know where the €1.9bn went, please give Wirecard a heads up. More interesting from a trading point of view is that despite the ongoing investigations and especially after the allegations have been brought forward by the FT, some major German Asset Management firms though it was a smart move to invest in Wirecard after ten years of absence in the stock. Apparently, better late than never was the motto. “DWS said at the close on Wednesday that it had already cut its actively managed position in the company by around 60% and by the close on Thursday.” However, this implies that DWS cut down it’s position by 40% on the day of the crash, creating at loss of around €230mn. I’m not sure if this is sound risk management or just speculation gone wrong. Probably depends on the initial position and the risk investors were willing to take . On the other hand, massive losses mean massive profits for short sellers, among them the FP Argonaut Absolute Return Fund. I’m curious were the story will head in the coming weeks. Maybe Robinhood’s gamblers strategic investors will discover Wirecard as the new bargain! #makeWDIgreatagain
Facts and fantasies about correlations
One article that caught my attention this week was on “Defensive & Diversifying Strategies: What Has Worked in 2020?” by Nicholas Rabener. The article basically shows that defensive smart beta strategies like low vol did not offer much capital protection in 2020. It also discusses the benefits of diversified Managed Futures and Multi Factor long-short strategies in the current market crash:
We observe that year-to-date in 2020 only managed futures generated positive returns. The performance of multi-factor long-short investing was consistently negative since the beginning of the year, which is primarily explained by the poor performance of the value factor, which is a core component of these portfolios.
The article nicely shows both strategies low correlation to the S&P 500:
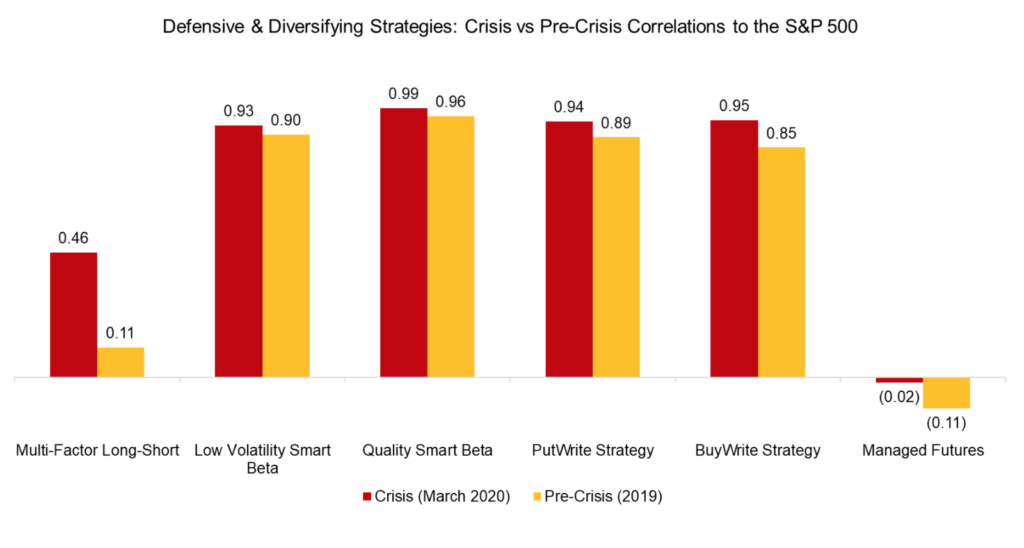 source: Defensive & Diversifying Strategies: What Has Worked in 2020?
As you probably know, we are huge proponents of Trend Following (TF) strategies and their benefits for overall portfolio diversification. This also includes their low to slightly negative correlation to major equity indices. However, I wanted to take this opportunity to issue a few cautious words on correlations and expectations towards them in general.
Low to negative correlation of Trend Following returns to equities does not mean your strategy will always act opposite to equity markets. Especially for smaller equity market movements, this might not be the case. Correlation is a measure of linear relationship. In contrast, the payoff of a Trend Following stratey is convex and hence nonlinear by construction. The payoff is similar to a straddle. The position allows the investor to profit if the price of the underlying security moves significantly in either direction:
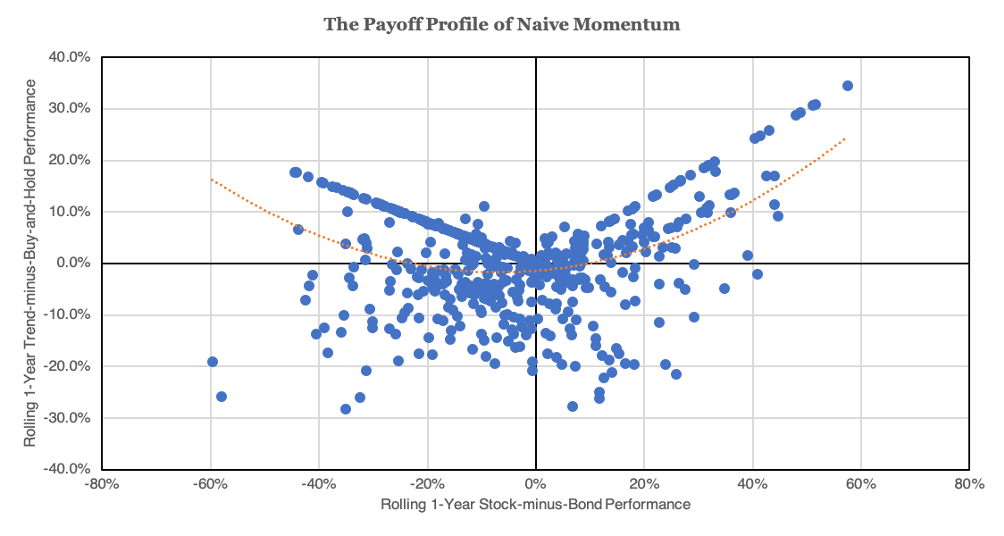
source: Newfound Research: Straddles and Trend Following
A similar example from the real world is hand grip strength (see figure a). It initially increases with age (through childhood and adolescence), peaks at age 25 for reasons I do not want to further elaborate, and then declines. I did not make up this example! The curve is inverted if you compare it with the TF payoff profile, but you get the point: If estimate correlations on this type of quadratic polynomial, your estimate will be near zero or even slightly negative in case of TF.
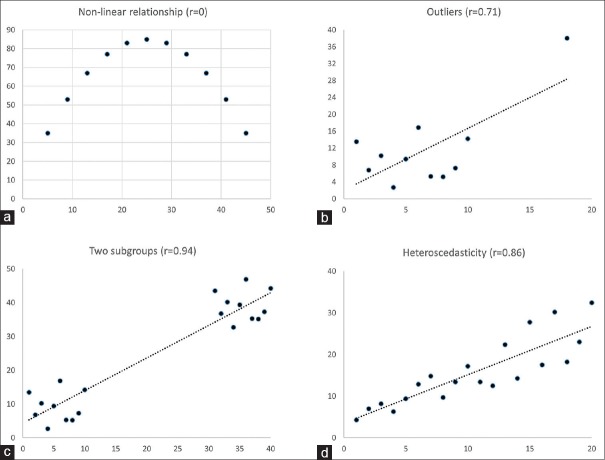
source: Common pitfalls in statistical analysis: The use of correlation techniques.
Outliers are another thinng that make correlation an suboptimal estimator for dependence between different strategy returns. If you compare figure b) this with the TF payoff, you can already imagine that the huge positive tail for TF strategy also biases your correlation estimate. Another factor is time-varying volatility (heteroscedasticity), which is one of the stylized facts of financial time series (see figure d). If you want to calculate correlations between two time-series and one, or even both of them exhibit heteroscedasticity, this seriously biases your correlation estimate. To make things worse, correlation is usually time-varying itself (that’s why people usually use Riskmetrics or Dynamic conditional correlation models). I would not dismiss correlations as a measure itself completely, but it makes sense to check the underlying assumptions and switch to other dependence measures (e.g. rank correlation, tail dependence or piecewise correlation for a non-linear relationship). Similar to the payoff profile figure above, you can also use sophisticated econometric models, such as eye-balling to identify the underlying dynamics.
To summarize: Your TF strategy might be like the guy who always shows up late to the party. He’s only there because the first party ran out of alcohol and this was the best option anyone could think of. It does exactly what it was designed to do. It’s following its nature.
#happytrading