Now that we’ve switched to the new design of our website, some of you might have noticed that there have been two additions to the Twoquants-team as well. We’ve added two non-human members. One of them is Jamie, Moritz S.’s most faithful follower and our office companion. The second one, which I want to introduce in this article, is an artificial intelligence, Twitter and Bitcoin enthusiast called the Real Vision Bot (the “Bot”).
The bot is the result of our recent research project which evaluates the performance of trading ideas of professional investors and hedge fund managers on “the Netflix of Finance” Real Vision (“RV”). If you want to know more about that, we put out a working paper on that topic recently.
While the initial bot was limited to being a pure data gatherer, I used my home office time to extend upon the concept of having an engine that automatically downloads, classifies and evaluates all interview transcripts from the Real Vision website. I’m regularly posting results of this analysis on Twitter using the Bot’s account (@RealVisionBot). Since the Bot has amassed a steady following, there were a lot of questions about the methodology and scope of this analysis. In this post I’ll give the interested reader a bit of an overview about the applications of this artificial intelligence on textual data and which insights can be derived from it.
1. How does it work?
Currently, the Bot has two main functions: First, it reads the transcript of each video published on Real Vision, parsing raw interview text and meta information. Meta information already includes several information: recording and streaming date of the video, title, abstract, interviewer and interviewee, name of the show, tags and even likes and dislikes. Raw interview text includes every word spoken in the video, which can be attributed to the respective person based on the structure of interview.
Second, Raoul Pal, the CEO and co-founder of RV, had the great idea that the Bot could also do a weekly survey on “The Exchange” – a platform recently launched by RV where members can exchange ideas and discuss with the RV team and guests. Of course, I immediately got hooked and volunteered – and the Bot had no other choice than to do my bidding. So, the Bot now also conducts a weekly market sentiment survey where it asks people about their views on the markets for a one and three month time horizon. You can check it out here. The survey is open from Wednesdays to Saturdays and results are summarized on an interactive (preliminary) dashboard.
2. That sounds like a lot of data? What happens with all of that?
The raw data is stored in a hierarchical database, which makes it easier for the Bot to find and analyze information. The Bot then performs some sanity checks on all the inputs, cleans up obvious mistakes and spelling errors. Then, the “magic” starts. For the RV interviews, he passes the interview text as a whole, and for each interview participant individually, through several machine learning models. These range from very simple methods, e.g., the counting of occurrences of certain keywords, to more complicated methodologies such as BERT by Google and GPT-2 by OpenAI (I’m also experimenting with GPT-3) for determining the sentiment of the interviews toward certain keywords and finding new keywords. The Bot currently uses several of these methodologies in combination to increase robustness. This allows for a topic specific sentiment analysis for each interview participant as illustrated in the Sankey chart below. The width of the lines are based on the bullishness and bearishness toward a specific topic in the interview.

3. Sometimes the Bot tweets crazy stuff. What does this mean?
The Bot is a daydreamer and desires to be a financial oracle (and it also wishes to be a #bitcoin mining Bot). While its responses and tweets may sound ambiguous, there is always a hidden truth and rationality behind them. Don’t be disappointed if the Bot leaves you puzzled – it’s for your own good. The crazy tweets result from its machine learning engine and are completely artificial. It learns based on the RV interviews and from time to time I select some of its best “thoughts” and trigger a tweet.
Let’s keep it simple for now. So we’re going to have to create an essentially a real time broker to take all of our price activity and and create a real time technical analysis. There’s a few data sets that we’ve had that do this. One is the VIX, the West Coast intermediate VIX
— Real Vision Bot (@RealVisionBot) August 11, 2020
4. I want to see more results!
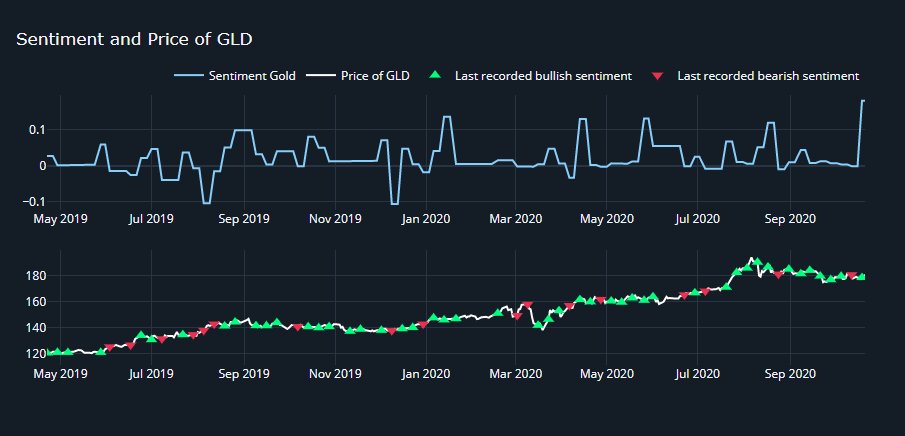
OK, so the Bot actually does a lot more. It informs you about each week’s most important topics and the sentiment toward them. The most important of these are what I call “investable topics.” This is the sentiment toward things like stock market indices (e.g., S&P 500), Gold, Bitcoin, Volatility or the USD. The sentiment can be tracked over time and an investment strategy can be developed. Below I plot the price of the GLD ETF (Gold) vs. the sentiment toward Gold in the interviews. Interviews that happen on the same day are aggregated by their weighted sentiment so that each triangle represents a day where Gold sentiment was found in one or more interviews. While the sample is short and probably unique, this is still a compelling example of what can be done with the data.
Based on the most prominent investment topics, Equities, Gold, Bitcoin and Volatility, I constructed a simple long-neutral portfolio that equally weights the components for the next week if the sentiment during the previous week was positive. Otherwise the portfolio goes to cash. A simple example of this hypothetical RV Bot portfolio is shown below.
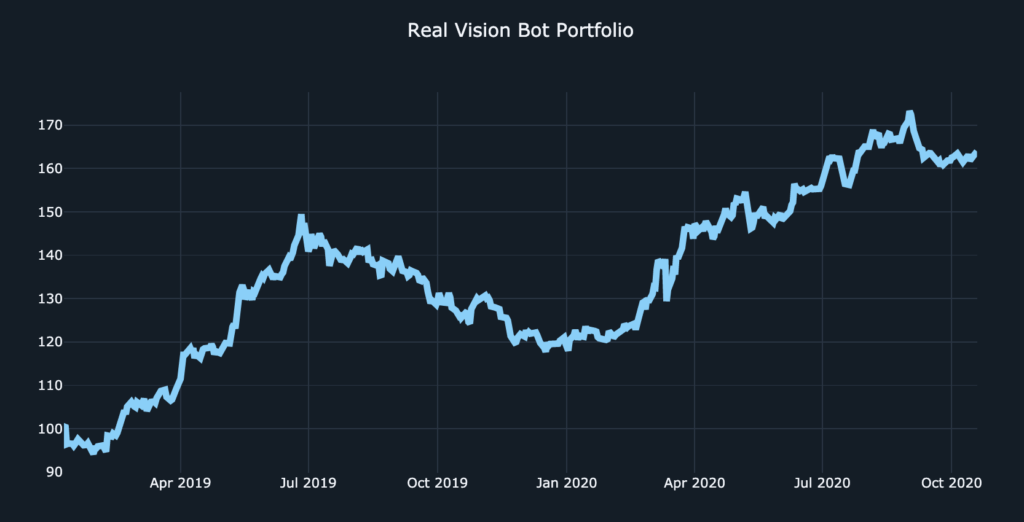
Note that this is extremely simplified. I used ETFs, so TER is included but no transaction costs are assumed for this exercise. Rebalancing happens weekly based on Monday’s close. It’s still a nice idea and I even plan to trade this to see if it can hold up in reality.
5. I heard Real Vision is a bear fest. Is the data really useful?
First of all I would not say that it is a bear fest. So far the sentiment analysis I did revealed a lot of positivity toward various “normal” investment topics on the platform. It’s not as if the RV crowd only enjoyed Gold, Bitcoin and a life-long supply of rum. Many of the interviews discuss investing opportunities in equities, bonds or alternative asset classes as well, and if you follow the interview participants more closely you will see that it’s quite a diverse crowd.
Nevertheless, I wanted something that can smell blood in the investment water – so I gave the Bot an additional task: Go look for the frequency of words related to economic concerns such as bankruptcy, unemployment, crisis, recession etc. I took the idea from the paper by Da, Engelberg and Zhao (2015), “The sum of all FEARS” where a similar methodology is used based on the Google Trends search volume. Having worked with the Google Trends data myself a lot, I definitely wanted to see what the Bot can extract from this methodology. At that moment, the FEAR-Bot Index (Financial and Economic Attitudes Revealed by Bot) was born.
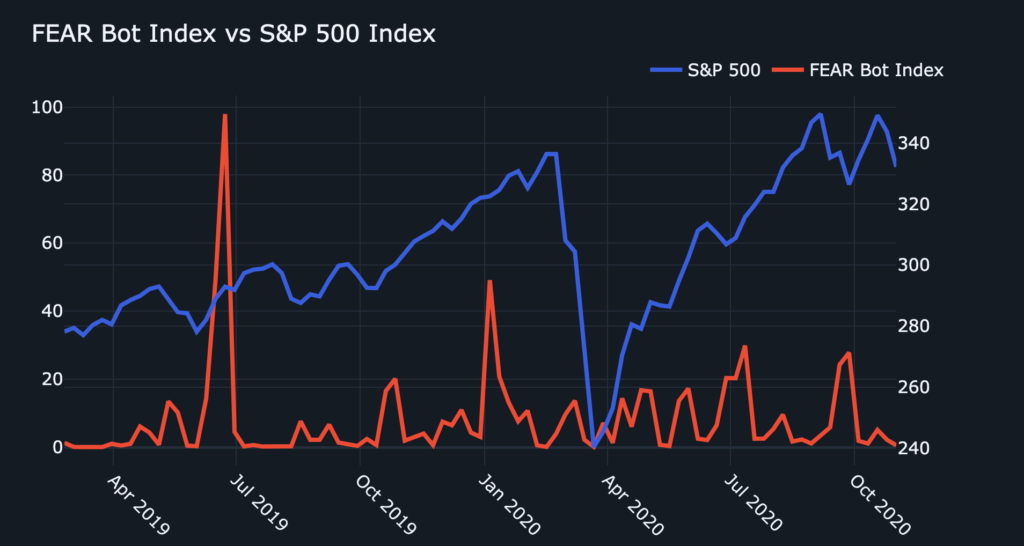
The weekly FEAR-Bot Index plotted against the S&P 500 shows some interesting dynamics, despite the still small sample. By employing a famous statistical methodology called “eyeballing,” I spotted some foresight in the index. While the biggest spike was around 6-8 weeks before the market whiplash in August 2019 (the S&P 500 posted 11 moves of more than 1% in 22 trading sessions for August 2019) more was about to come. The second large spike was in the first week of January 2020. And we all know what happened at the end of February 2020.
But no, it’s not just eyeballing. Actually, if we look at cross-correlations between the FEAR Index, S&P 500 and VIX, the same pattern emerges.
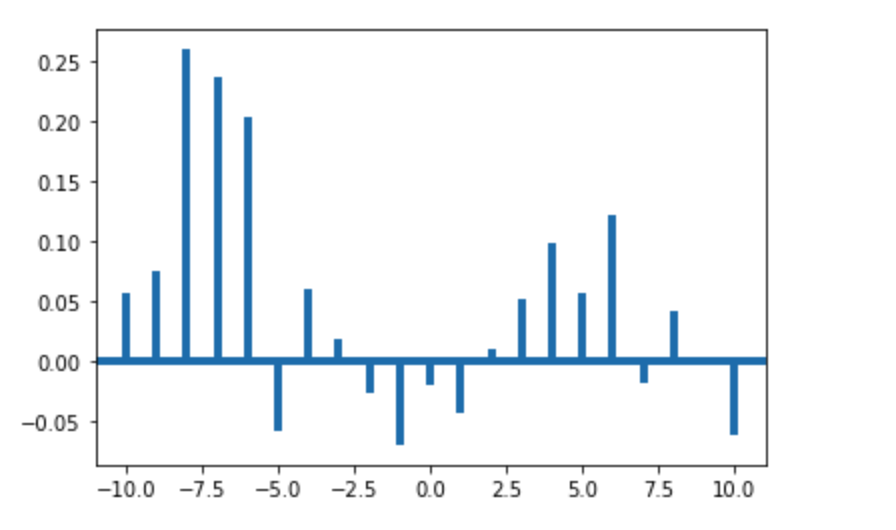
Let’s now have a quick look at the cross-correlations of returns between the VIX, S&P 500 and the FEAR Index. The methodology is quite simple. The chart shows the correlation between a lagged version of the FEAR index and the S&P 500 (not lagged). Bars to the left mean that the FEAR Index is a leading indicator, bars to the right show the influence the S&P has on future FEAR Index.
As you can see below, there is a positive leading effect starting from lag 6 to 8 (correlation between 0.2 up to 0.25) which the FEAR Index has on the VIX. Hence, a rising FEAR Index is correlated with a future increase in the VIX in 6-8 weeks. On the other hand, the VIX also has some smaller leading effects on the FEAR index.
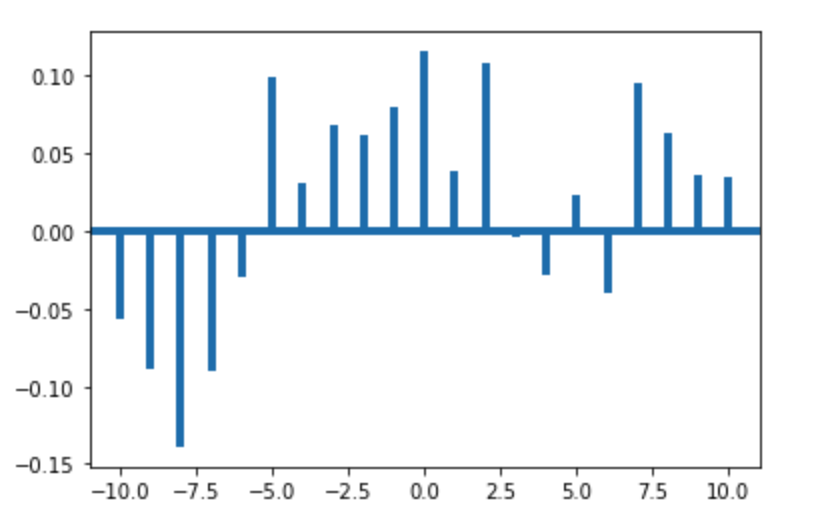
Doing the same exercise for the S&P 500 and the FEAR Index shows that results are more mixed. While on a longer horizon correlations are negative (increasing FEAR Index, decrease in S&P 500), short term results are positive. This is a little bit confusing, since basically it tells you to buy the S&P when FEAR is high until it explodes… if this sounds like a carry strategy to you, it probably is. The Bot will continue its efforts to gain more insights from this, and with an increased sample size we’ll check if the Index is really a leading indicator or rather a contrarian.
6. So what’s up with this weekly survey, where can I see the results?
Raoul summarized it very nicely, so I’ll just leave it here.
This is incredible work by @twoquants @RealVisionBot An amazingly high quality sentiment survey using AI to scrape interviews, surveys and index construction to take data from RV members and turn them into something useful and then CFTC data to compare. https://t.co/ntHQc8AKFr
— Raoul Pal (@RaoulGMI) October 11, 2020
On its little dashboard, the Bot also plots the weekly RV Exchange sentiment in comparison to the RV interview sentiment and sentiment obtained by parsing the CFTC’s Commitment of Traders reports. This allows the Bot to create a diversified view on the market and study the disagreement between the respective sentiments. Why? Well, a certain degree of disagreement is usually a good sign, while too much dispersion or consensus can be a sign for upcoming market volatility or even a trend reversal.
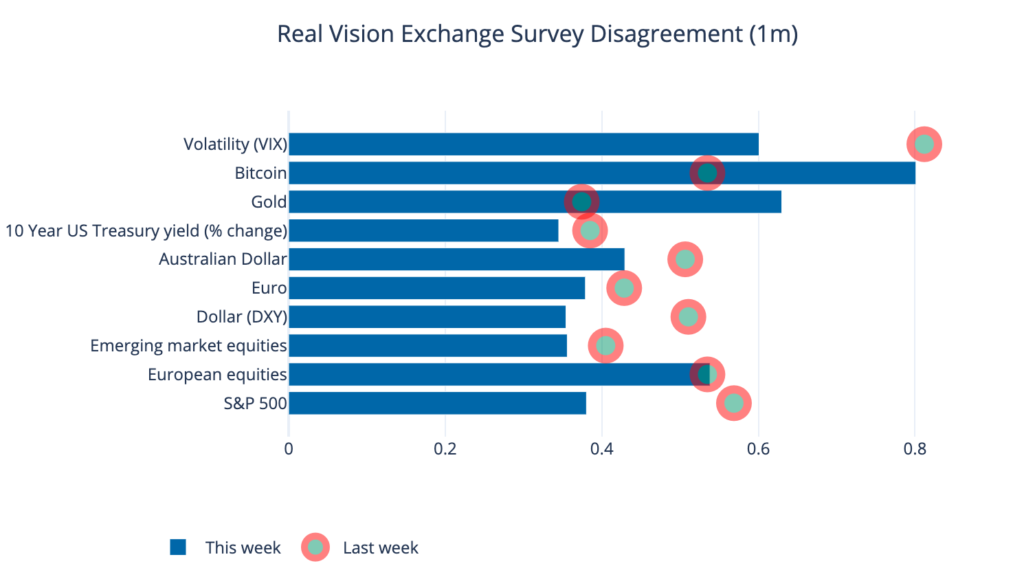
Shown above is the RV Exchange sentiment disagreement for the end of October. A value close to 1 shows a lot of agreement in the survey, while a value of 0 would mean survey participants disagree on the direction of the market in an extreme way. Hence, the RV Exchange members agree a lot on the direction of Volatility and Bitcoin (in that case that was along the existing price trend, namely upward) but are otherwise quite evenly spread in their opinions. I’ll dig into the topic of the usefulness of surveying disagreement over time in a separate post.
7. What are the next plans for the Bot?
The Bot is pretty much still work in progress. Next steps are expanding its AI capabilities so it can better learn from its mistakes and launching its own dedicated page on Twoquants. The current dashboard shows only part of its potential. Another milestone will be finding a decent name for the little fellow – most likely I will ask the Twitter and RV Exchange for suggestions. If you have an idea, feel free to contact me via contact@twoquants.com. And no – “RaoulAI” is out of bounds!
8. The Bot is so cute. I want some merchandise!
We love to make its Fintwit groupies happy. You can find its merchandise in the official Twoquants store. Including its bestseller “Honk for Bitcoin”. All proceeds will be invested into its portfolio.
So long and #happytrading