What signals do you use to get into a trend following trade – price breakouts, or moving averages? That’s a question which has come up several times on the Systematic Investor podcast in recent years. Through this article I’d like to answer the question a bit more detail and give an overview of the most commonly used trend following trading signals.
Overview of popular trend following trading signals
- Price breakouts
- Price momentum
- Pattern recognition
- Volatility breakouts
- Moving averages
- Bollinger bands
- Price regression lines
Only the first three, price breakouts, price momentum, and pattern recognition are “pure” in the sense that they do not rely on any input other than the price itself. That purity is one reason why I decided to use price breakouts in my own trend following trading system. I don’t need fundamental data for my trading system. All the information that’s meaningful to me as a trend trader is already included in the price. Thus, since price is all I need, I want to use it in its cleanest form and not transform it into an indicator. A moving average, as a contrasting example, is an indicator. It’s a derivative of historical prices which dilutes the information that’s included in the price itself.
But let’s have a quick look at each method individually.
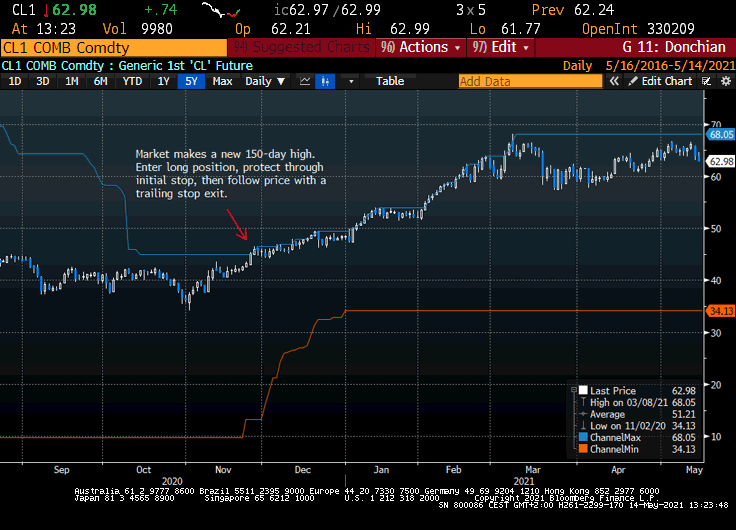
Price breakouts (also sometimes referred to as price channel breakouts, or Donchian channel breakouts) observe the highest high and lowest low of price over the past n periods. For example, the 100-day high means the highest price of the past 100 trading days. A trader who uses the 100-day breakout window will open a long position when the price makes a fresh 100-day high (vice versa for a short position). That’s it, that’s the entry signal. Some traders (me) will then use an ATR-based initial stop to protect the new position and a trailing stop exit (also ATR-based) to eventually close it. This allows me to normalize my results in ATR-space (or in terms of “R” as per Van Tharp). Other traders may choose to exit a long position on a new n-day low instead of using an ATR-based trailing stop (and numerous other exit alternatives exist, which is why researching several methods to discover the one which matches what you want is important and fun).
The following chart shows crude oil, and the red arrow marks a new 150-day high. A breakout trader who uses the 150-day window will now enter a long position.

Price momentum methods (also know as absolute momentum or time series momentum) compare the most recent price to the price n periods ago. For example, one might compare today’s price to the price one month ago (or 3 months, 6 months, X months ago). The rule is to be long if the current price is higher than the price n periods ago, else be short. That’s also simple and “clean” but in addition to choosing the period n, the trader now also needs to decide when to compare the prices against each other. Daily comparisons will result in many small positions as each observation will produce a trade, either long or short, unless the current price and the historical price are identical. Alternatively, the trader may opt to compare prices at the end of each week or at month-end only, which increases timing risk.
Pattern recognition methods will signal to enter a trade once prices have completed certain patterns which the trader concluded to have edge (which have resulted in a positive trading outcome in the past, i.e., in sample). For example, a trader may choose to enter a new position once the market has completed a zig-zag move. Such zig-zag move could be defined as a price sequence where the price advances, pulls back, and then advances again. Think of a mover higher, followed by a move lower which has a higher low than the previous low, completed by a move higher which has both a new higher high and a higher low than the previous move. The possible pattern combinations are endless. You can test thousands of pattern recognition systems. The trouble with the vast majority of them is that they don’t recur frequently enough to really have any statistical validity. One trader who uses pattern recognition methods very successfully is Bill Dreiss. Bill has a very strong long-term performance record based on 100% trend following. You can learn more about him here.
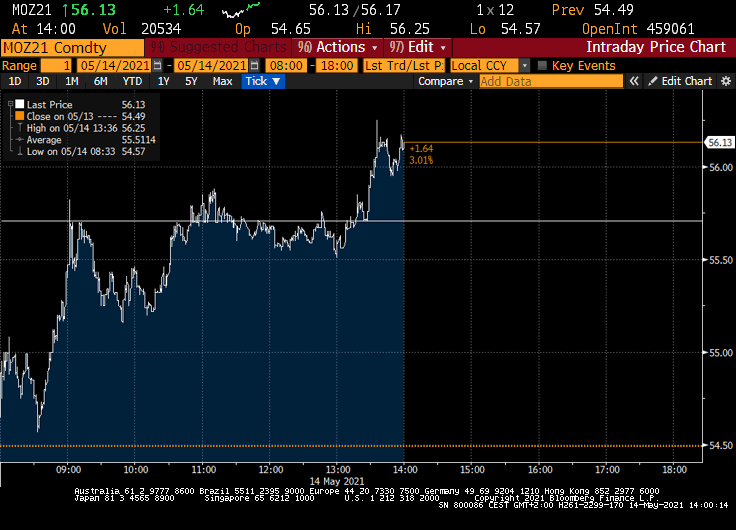
Volatility breakouts rely on volatility-based stops to enter positions. For example, the rule may be to enter a new long position on a stop where the stop sits n ATRs above the most recent closing price. The volatility breakout trader is looking for a large price move (a large volatility move) and seeks to follow that move beyond the entry stop level. Personally, I’m not using volatility breakouts right now but have done so in the past. While volatility breakout signals can be used to get into medium and long-term trend following positions, they are more commonly used by short-term trend traders whose systems have average hold period of only a few days.
The below chart shows the intraday performance of Dec 21 EUA emission futures on 14 May 2021. The white horizontal line sits 1.25 ATRs above the most recent close. That’s the level for the buy stop.

Moving averages come in many variations. Simple (arithmetic) moving averages, geometric moving averages, weighted and exponentially weighted moving averages, and so on. Most commonly known are the 100-day and 200-day simple moving averages. For example, a trader might use that signal to be long the market when it trades higher than its moving average, or else be short. In that example there’s no “neutral zone” though. The trader is either long or short – always. Personally, I’m not a fan of these continuous trading systems which force me to hold a position. Why play when there’s no reason to play? Staying on the sidelines, doing nothing if there’s nothing to do, is an advantage I don’t want to pass on. It’s of course possible to combine a moving average entry with a protective stop and an exit rule which is not based on the moving average itself, in which case the position would return to neutral once the stop or exit are hit. However, it seems that most traders don’t use moving averages in this way.
Moving average crossovers are also popular, as are triple moving average systems. At the end of the day all of them are derivatives of price and thus less clean than signals which are based on nothing but price itself. In my experience, moving average-based systems don’t stick to positions as long and as breakout systems do when using the same expected trading speeds. Moving average systems also tend to get whipped more, especially during markets which are trapped inside a narrow range. It doesn’t take much for the moving average signal to change back and forth, whereas it would take longer for a breakout system to run into its stop or reach a new high or low to exit the position. That said, moving average-based systems can get the trader into a new position earlier than breakout-based signals.
The red arrow in the below chart marks a “golden cross” based on a 200/50 moving average crossover. Once the faster 50-day moving average exceeds the slower 200-day moving average, a long position is opened.

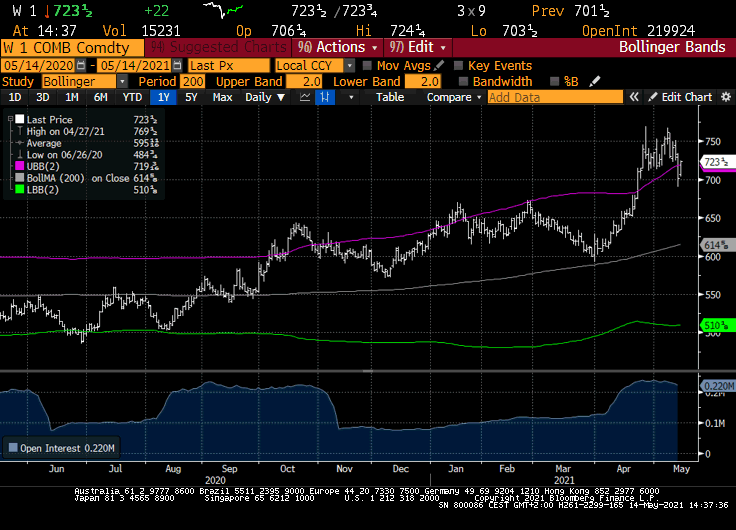
Bollinger bands, developed by John Bollinger, are used to create a volatility-dependent band around the market’s average price. For instance, the average price could be 200-day moving average and the upper and lower boundaries of the band would sit two standard deviations higher and lower than that average. One can of course tweak the parameters for Bollinger bands in accordance with one’s own preferences, e.g., a trader may use a 95-day exponential moving average and have the upper and lower boundaries 1.7 standard deviations away. When used as a signal for trend trading systems, a trader would generally open a long position when the price reaches or trades through the upper boundary (and vice versa for a short position).
Below is a Bollinger band chart for front-month wheat. The average price, shown in gray, is a 200-day simple moving average and the upper (purple) and lower (green) boundaries are two standard deviations away.

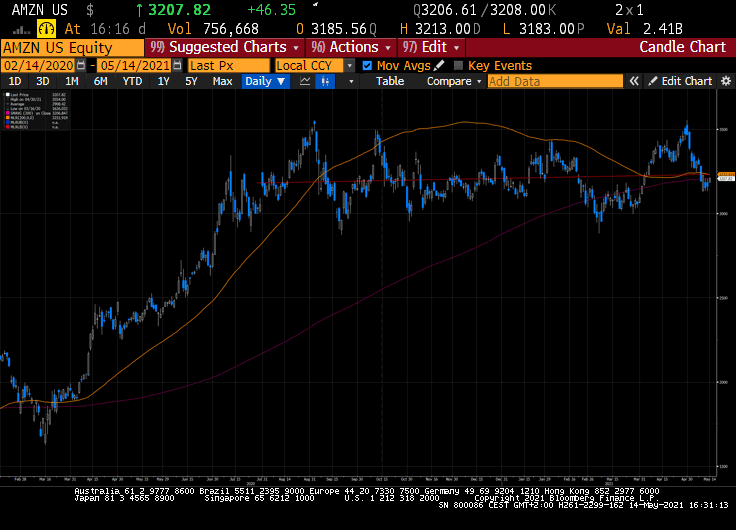
Price regression lines are the result of calculating a linear “best fit” line to match the general trend in the data. The red dotted line in the following chart shows a single 200-day linear regression line for AMZN. The line is almost horizontal because a consistent trend has been absent in AMZN during the past 200 days. The moving linear regression line, depicted in orange, will show the development of various single linear regression lines over time. The endpoints of the two lines will meet at the same point assuming they have the same lookback period (in the chart both are 200 days). While moving linear regression lines may look similar to moving averages, they differ in calculation. A moving average calculates the average of historical prices over time, whereas a moving linear regression line connects the endpoints of a series of single regression lines. As a consequence, moving linear regression lines tend to stay much closer to the current price than moving averages of the same length. In the below chart the 200-day simple moving average, shown in purple, has a greater average distance to the price than the moving regression line. A trend trader who uses price regression might take a long position when the market’s price is above the moving regression line or when it’s upward-sloping.

Summary
The most important trade is the entry trade, since without an entry trade you don’t have a position. Whether the entry signal is generated by a price breakout, a moving average, or another method is – in my personal opinion – less important than the usage of an initial stop and a good exit rule. Over long time periods, the various entry methods which I’ve outlined above tend to produce similar results when combined with initial stops and exits. I prefer to keep my methods as simple and pure as possible, and breakouts fall into this category. Breakouts allow me to stay out of the market when there’s no reason to hold a position, which is also important to me. I don’t want to play when there’s no reason to play. Last but not least, proper ATR-normalized position sizing, in combination with stop and exit rules, means that I can cut losers short and let winners run. Imagine applying this to many unrelated markets at the same time, rigorously and without interfering with your own rules, and without overlays such as volatility-controlled position sizing… that’s quite nice 🙂


