We’ve reached the end of an intense and super-exciting year. This is a good time to share some stories, update you on the performance of our 2Q Portfolio, and discuss some interesting positions and trade ideas.
All performance numbers are as of 30 December 2021 – which from a trading point of view means that the “year is still young” and that a lot can still happen between now and the close of business at year-end.
As our followers know, the 2Q Portfolio tends to realize 20-25% volatility. We combine systematic futures strategies, both directional and non-directional (spreads) with options and positions where we think the payout is lopsided, i.e., where the upside is multiples of the downside. While the 2Q Portfolio is suitable for us and our own money, it’s certainly not suitable for everyone. Drawdowns are a natural consequence when trading at 25% volatility, and although we didn’t have a large loss in 2021, we know that there could very well be a deep and long-lasting drawdown just around the corner.
Our YTD performance is 47%, give or take, with only 3 down months (May, November, December). This, we think, is an exceptionally low number of losing months. We expect there to be more losing months in future years.
| % | JAN | FEB | MAR | APR | MAY | JUN | JUL | AUG | SEP | OCT | NOV | DEC | TOTAL |
|---|---|---|---|---|---|---|---|---|---|---|---|---|---|
| 2019 | 0.11 | -2.17 | -1.27 | -3.34 | |||||||||
| 2020 | 11.28 | 7.35 | 21.31 | 6.71 | -10.45 | -2.47 | 3.24 | -0.66 | -4.17 | -5.57 | 3.66 | 6.28 | 36.5 |
| 2021 | 0.61 | 3.97 | 10.18 | 1.22 | -0.25 | 11.61 | 0.71 | 9.24 | 3.55 | 11.81 | -0.7 | -5.42 | 46.55 |
What cannot be seen in this performance table is that November showed an intra-month loss of more than -10% before our strategies recovered, ending the month with a minor loss of 70 bps.
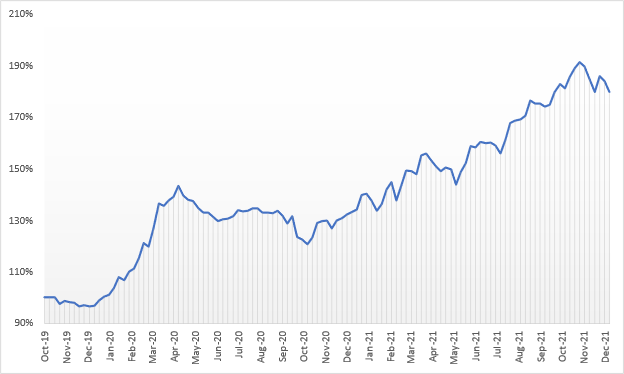
Our CAGR since its inception in October 2019 is around 31%. The worst drawdown to date is -22.65%.
The following chart shows the performance curve for the 2Q Portfolio since inception on an end-of-week basis.
But let’s start at the beginning and review some of our opportunistic and vol-driven trades this year (systematic strategies will be discussed further down below).
The “skunks at our garden party” arrived very early this year, in January. Skunk #1 was GME, and skunk #2 was AMC. To repeat, probably ad nauseam now, we got lured into selling upside calls on both names when their prices and implied vols started mooning. And we were handed the bill right away. Lesson: The fact that something has never before happened in the markets (the combination of Reddit, Robinhood, and so on) does not mean it can’t or won’t happen. That’s trading 1-0-1 and something we understand, but a repeat-mentioning of that lesson probably doesn’t hurt – neither you nor us.
It’s best to stay away from things you have no business dealing with.
We took the loss on GME and AMC but decided to keep a gimlet eye on both names in the following weeks. Once the craziness had settled down a bit, we started selling OTM delta-hedged puts. The options still traded at very high levels of implied vol. We engaged in that trade for about three months, and we were able to recover our losses from the short calls and then some. When all was said and done, we took home a nice positive PL. It’s been quite a rollercoaster though.
But not the only rollercoaster. Far from it.
Another wild one was the short TTF April-May 2022 position, which we had opened at EUR 3 in mid-August. This spread rallied against us pretty much right away, topping out 4x higher at EUR 12. I’ve explained the rationale for that trade a couple of times on “The Systematic Investor” podcast with Niels, but it all took a while to play out – and it came with much more volatility than one would expect for a spread that isn’t crossing seasons. We got out of that trade on Wednesday this week at EUR 0.85 for a nice gain.
The gas markets are still highly volatile, on both sides of the Atlantic actually. This can be seen in the chart below which shows the price of February 2022 TTF. Volatile markets bring trading opportunities.
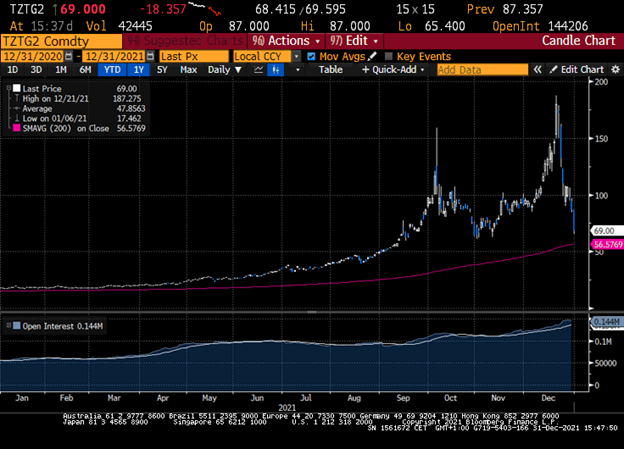
Here’s a trade that we put into the 2Q Portfolio just yesterday and today, which may very well start to behave like a call option without actually being one.
Again, it’s TTF. But this time it’s the widow-maker, which is the March-April spread.
We have zero interest being short that spread but are keen to own a long position at low levels.
We got long at EUR 7 on 30 December, as well as at EUR 4.5 today, December 31.
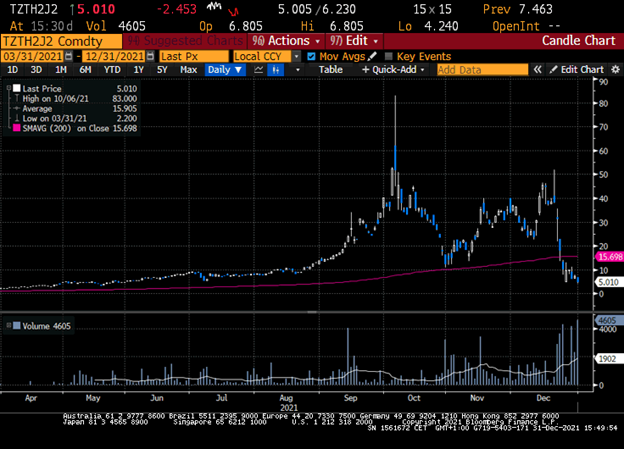
Theoretically, this spread could drop to zero or even turn negative. But given Europe’s current gas crisis, what are the odds of winter gas (March) trading at the same price as early summer gas, or even lower? We think those odds are slim.
Europe suffers from record low gas inventories as you read this, and there’s a risk of running out of gas if the winter comes in cold. Today, on New Year’s Eve, temperatures in the Munich area are around 15 C° which is unusually warm. The current warm weather pattern and recent news about an increasing amount of LNG arriving at European terminals seem to take a lot of risk out of this market. Given that we’re still in the early stages of the European winter, not to mention the situation with Russia and Ukraine, we think that risk is now priced too low.
Maybe this spread will decay to EUR 3 or EUR 2 if we get a very warm winter AND many more LNG deliveries at the same time, but absent this the downside for March-April seems limited whereas the upside can be very large.
It can easily pop to EUR 20, 30, 50 — explode. As the above chart shows, the spread traded north of EUR 50 just a few days ago. We like this lopsidedness.
Also, note that the 2023 March-April spread trades around EUR 26 (down from around EUR 70 a couple of days ago and 5-6 times higher than the 2022 spread). See chart below.
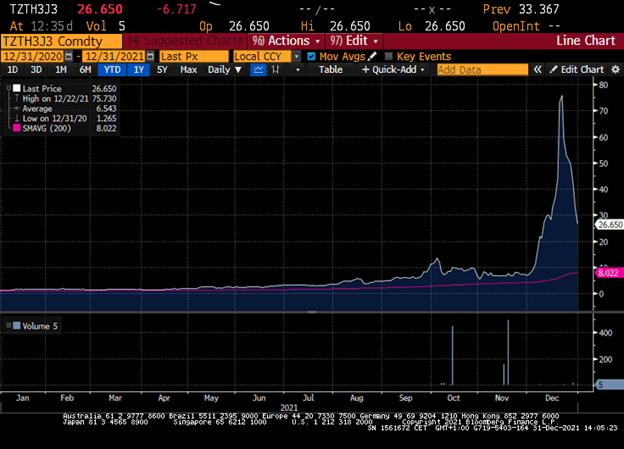
As mentioned earlier, LNG shipments from the US – clearly incentivized by the high prices here in Europe – have brought some short-term relief, but the flows from Russia remain very limited or nil, and there’s still no guidance on the start of Nordstream 2. About 20-30 LNG tankers are en route from the US to Europe or have already arrived.
An interesting fact to consider is this: A typical LNG cargo is appx. 150,000 cm of LNG, which expands about 600x when regasified, yielding 90,000,000 cm (or 90 mcm) per ship. For comparison, the Yamal-Europe pipeline, entering Germany at Mallnow station from Poland, has a total capacity of 89 mcm/day. Nordstream 1 which, unlike Nordstream 2, is in operation, has two pipelines with average flows of 75 mcm/day per pipeline, i.e., 150 mcm/d in total. To put things into perspective, the total imports from Norway during the winter tend to average 300+ mcm/day.
So, even though 20-30 LNG cargoes were bid away from other markets due to the recent price spike, those cargoes will only cover about a month’s worth of missing flows from the Yamal Pipeline (30 LNG cargoes at 90 mcm each would replace 30 days of flows at capacity on Yamal (89 mcm/d).
If there’s a cold snap here in Europe, those LNG deliveries won’t be sufficient.
Moving on from gas, if you’re a Twoquants-follower you know that we own long-dated calls on Eurostoxx 50 and Nikkei 225. Implied vol aside for a second, a key reason for this trade is the backwardated forward curve (the expected income from dividends and securities lending is higher than the interest which needs to be paid to fund the trade, which is negative). We can fund the investment at the inter-bank traded negative interest rate, i.e., get paid for it, while holding a positively convex position and sit on a lot of vega (as the maturity is far away). What’s not to like? We think that’s a great risk-reward position to have. We hold positions in December 2024 and December 2025 expiries, with strikes around ATM as well as 5-15% OTM.
As an aside, if you sit on stock market gains, you may want to consider an equity replacement trade. Rather than buying ATM and OTM strikes, you could go long an ITM or deep ITM strike and replace your stock position with a high-delta call option. It’s a great trade from a funding perspective while being protective in the event of a stock market crash.
BTW, while selling the OTM puts on Eurostoxx 50 and Nikkei 225 also looks attractive from a forward and skew point of view, we’d rather stay away from this trade. As you know, in our 2Q Portfolio we aim to combine several systematic trading strategies (directional and spreads) with positively convex, long volatility trades where we think the risk-reward is skewed in our favor. We actually own some shorter-dated Eurostoxx 50 OTM puts, and we have a small long position in VSTOXX February 2022 futures.
Changing topic, we remain long Eurostoxx dividends for December 2022 and December 2023. We’ll probably roll from December 2022 to December 2024 when the 2022 dividends start “pulling to par” as companies start paying out in H1 of next year. We may also increase our long exposure to December 2023 depending on where it’s trading around that time.
But back to options. Another options trade we have on, and which we like a lot, is this: long WTI calls, with strikes between $80-100, and expirations between December 2022 to December 2024. The entire WTI curve is backwardated as of today, which makes long-dated calls attractive (February 2022 WTI is at $77 whereas December 2024 WTI trades at $63). You will have noticed that there’s a lot of ESG pressure on fossil fuels right now, from oil companies to cement and steel producers, to coal and crude oil. While well-intended and aimed at mitigating global warming, the consequences of such behavior aren’t fully thought through in our opinion. The transition from fossil fuels to green energies will take time – a lot of time – and the more we punish fossil fuel companies today, the higher the future price of that fuel (as oil and exploration companies won’t invest and rather spend cash on to buy back their own stock at low valuations). This failure to invest in a capital-intensive business makes higher fossil fuel prices more likely down the road. We’ve seen this play out this year already (coal, for example), but there’s likely more to come. And let’s not to forget the geopolitical risks which could easily propel prices higher, too.
We also hold long positions in some oil stocks (e.g., XOM), most of which have high dividend yields (in the 4-6% range).
And then there’s carbon. EUA futures to be precise which, as you know, we’re long since quite a while. About two weeks ago we saw a EUR 90 print on the tape, and we’re now back down to around EUR 80. This is still a great level to get long as the rules underpinning the MSR, should they remain unchanged, will decrease the number of available allowances over time. Pollution will become more expensive (which is aligned with current politics) as a smaller number of allowances is made available to the market. Unsurprisingly, assets that are scarce and cannot be quantitatively eased tend to rise in price. In the case of EUAs, their number could be quantitatively eased (increased) in response to a political decision, so the trade surely isn’t without risk. But from a trading point of view, it’s a risk worth taking given the enormous ESG and climate-impact focus that’s prevalent today (not to mention the billions of EUR that flows to governments in Europe from EUA auctions).
Last but not least: digital assets. We’re probably beating a dead horse by now, and no matter whether you understand Bitcoin, or whether you think it’s good or bad for society, from a trading point of view there’s only one position to have today: long. Appropriately sized, but long. It’s still a lopsided position, and that’s good for our trading book.
We don’t have any BTC or ETH basis trades on right now. They actually may never come back to levels where we’d like to engage again. We’ve had a great time with them though.
And now the systematic part.
We combine several directional and spread-based systematic strategies. These strategies trade futures and make use of trend following trading techniques.
Here’s a table showing the markets in which we hold directional trend following positions as of today:
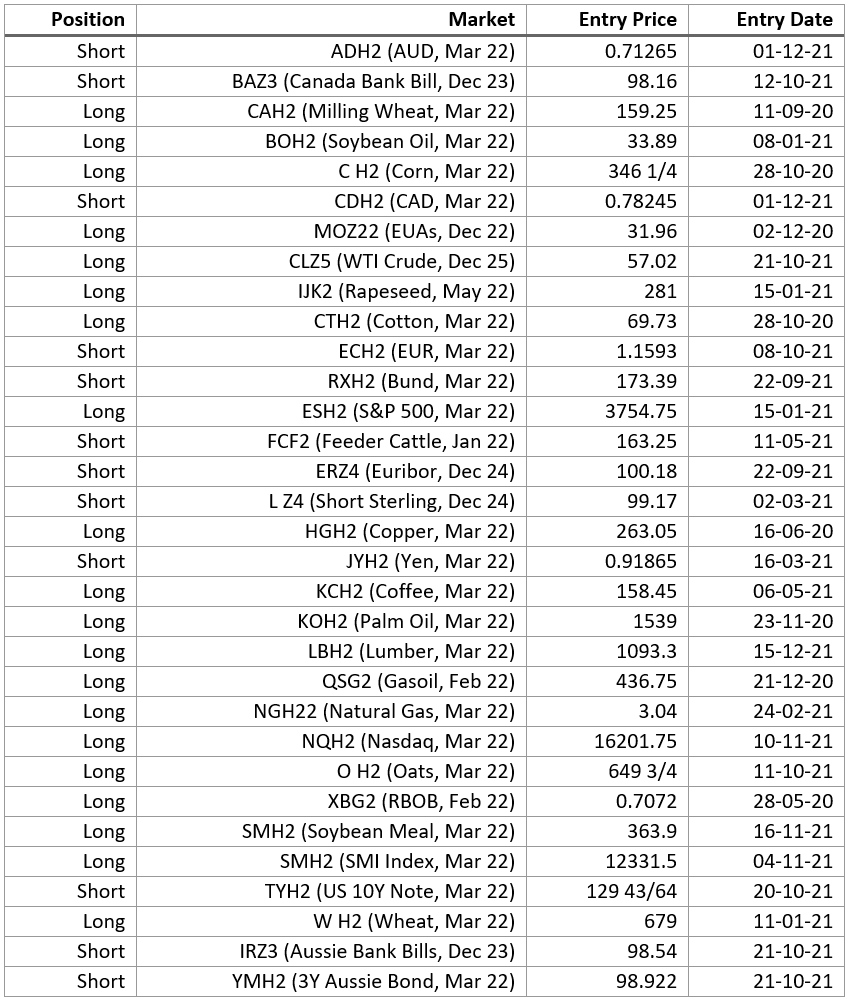
Note that the Entry Price and Entry Date columns show a back-adjusted entry level and the original entry date. Thus, they do not necessarily show the entry price and entry date for the current contract. For example, MOZ22 are Dec 22 EUA emissions futures, but the long position was originally opened in the Dec 21 contract on 2 Dec 2020 at a back-adjusted price of EUR 31.96. We rolled Dec 21 into Dec 22 a couple of weeks ago.
The largest part of the 2Q Portfolio PL is the result of our systematic, directional trend following futures trading. It’s about 30% of the 47% which we have in total.
Our spread trading systems have contributed about 12% and the opportunistic, vol-driven trades about 5%.
Below is a selection of notable spreads which we have on right now (not showing all spread positions):
- Long Feeder Cattle, Aug 22 – Nov 22
- Short Lean Hogs, Feb 22 – Aug 22
- Long Copper, Mar 22 – Sep 22
- Long WTI Crude, Mar 22 – Sep 22
- Short Live Cattle, Feb 22 – Apr 22
- Short Sugar, Mar 22 – Oct 22
- Long Corn Mar 22 vs short Wheat Dec 22
- Long Kansas Wheat Dec 22 vs short Wheat Dec 22
- Long Soybean Meal Mar 22 vs short Soybean Oil Mar 22
We wish you a prosperous year 2022 and lots of trading success.


