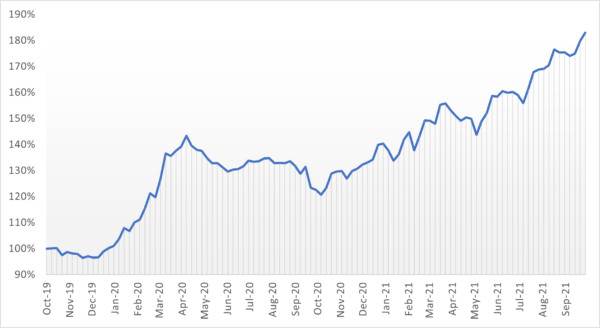
It’s been a while since we published the last update on our 2Q Portfolio. While we update the live performance numbers each week on our website here, we don’t usually release details on the 2Q Portfolio’s positioning or its return drivers. But, with the third quarter now behind us, we reckon it’s about time to provide you with some more context and explanations – especially since many of you have asked.
Recall that the 2Q Portfolio combines systematic strategies and opportunistic trade ideas. You can read more about it in our 2Q Portfolio presentation.
The systematic strategies break down into about 70% classic trend following and about 30% rules-based spread trading – all in futures markets. The spread trading system includes calendar spreads, product spreads, and cross-market spreads.
As per October 15, the systematic strategies are up about 35% YTD. About 26% of that comes from trend following. The remaining 9% are from the spread system.
This systematic part of the 2Q Portfolio is what you can hear me talk about on the Systematic Investor podcast, normally on a monthly basis.
The full 2Q Portfolio shows a performance of 49% YTD, meaning that our opportunistic trades added another 14% to the 35% from the systematic bucket. We’ve realized a portfolio volatility of about 22% based on daily returns. Although the 2Q Portfolio sits at a new all-time high today, we shall not forget that drawdowns are a natural consequence of trading in the markets and, looking ahead, we fully expect to experience a deeper drawdown than the 22.65% peak-to-trough loss recorded to date.


We’re having a great time with our classic trend following trading approach this year, especially in commodity markets such as lumber, cotton, natural gas, and copper. In recent days we’ve seen some changes to the trend following portfolio, most notably new shorts in equities and bonds. It will be interesting to see how this plays out into year-end. We remain long in most commodities though.
Some of our directional trend positions are shown in the list below:
Directional trend following positions (selection)
- Lumber, X21, short (entry 2021-06-28)
- Cotton, Z21, long (entry 2020-10-28)
- Palm Oil, Z21, long (entry 2020-11-23)
- Milling Wheat, H22, long (entry 2020-09-11)
- Copper, Z21, long (entry 2020-06-16)
- RBOB Gasoline, Z21, long (entry 2020-05-28)
- Euribor, Z24, short (entry 2021-09-22)
- 10Y Gilts, Z21, short (entry 2021-10-05)
- MXN/USD, Z21, long (entry 2020-08-03)
- EUR/USD, Z21, short (entry 2021-10-08)
- SMI, Z21, short (entry 2021-10-05)
The spread trading system complements the trend strategies in several ways. For example, when we’re short calendar spreads, this tends to be a bit of a counterbalance to our directional long positions during times of reversals. Here’s an example. Assume we’re long Dec 21 crude oil in the trend following system while holding a short Feb 22 – Jun 22 calendar spread (short Feb, long Jun). Now assume Dec 21 crude oil drops strongly, resulting in us losing money on our long trend following position. In situations like this, the futures curve usually turns steeper (more contango), supporting our short spread position. Moreover, as be seen in this example, rather than being exposed to a single point on the crude oil futures curve (Dec 21), the overall portfolio is now active in three maturities, and the long exposure is now in Dec 21 as well as in Jun 22.
The opposite is true for bull spreads, i.e., long calendar spreads, which tend to have an offsetting return behavior to short directional positions (counterbalancing melt-ups and short squeezes).
We don’t see such counterbalancing behavior in our cross-market and product spreads, but like their very high diversification benefit to the overall portfolio.
Below is a summary of recent spread positions:
Calendar spreads
- Henry Hub NG, X21-K22, long (entry 2021-08-27)
- Cotton, Z21-K22, long (entry 2021-09-28)
- TTF Dutch Gas, J22-K22, short (entry 2021-09-30)
- Live Cattle, Z21-J22, short (entry 2021-08-31)
- Soybeans, F21-N21, short (entry 2021-10-14)
Cross-market spreads
- Corn vs. KC Wheat, Z21, short (entry 2021-07-15)
Product spreads
- Soybeans vs. Bean Oil, F22, short (entry 2021-09-24)
- Fine vs. Raw Sugar, H22, long (entry 2021-10-13)
Which brings us to our opportunistic trades. Perhaps unsurprisingly to many of you, we hold long positions in spot BTC and ETH. Those have been working very well for us during the past couple of weeks. What we don’t want to sweep under the rug is that they caused us some pain during the crypto crash in May and June, which forced us to reduce our position size.
We lost money on GME but were able to recover a good part of those losses later on when things moved from 100% crazy to only 99% crazy. I’d say that was 100% luck and 0% skill. I don’t want to go there again. Another lesson learned.
Another recent loser was a short Dec 21 call, strike $6.5, on Henry Hub natural gas which we established at the end of September. It was an overwrite to our long directional position in that same market, but we needed to drop it like a hot potato when NG started to get close to our strike. This may have been the worst possible time to exit that trade – who knows – but better safe than sorry. Since this was an overwrite (covered call) there was no naked gamma risk to the portfolio – something we avoid like the plague.
One position that has – and continues to – work well for us is our long position in EUA emission futures. It’s a position which we overwrite with calls, exploiting the high basis in the futures market, meaning calls are relatively expensive. It’s a trade which we have on since many months and it could well be that we’ll hold it for quite a while longer. Some market observers say EUAs could reach a price level of EUR 100 before year-end. We don’t have any expectations of that sort.
Turning the carbon story on its head, we decided to become active in Thungela – a “vice” trade which we wrote about here in July. We bought Thungela soon after its spin-off from Anglo American and subsequent listing in London. Thungela’s business is thermal coal, which is why it’s considered “dirty” by today’s ESG standards. ESG-driven investors were forced to sell Thungela following the separation from Anglo American, resulting in a very low valuation of the company. This low valuation in combination with high demand for coal in light of the current power and gas crisis in Europe and other parts of the world caused the stock to rally. We exited the stock – too soon it seems – in mid-September.
We’re down YTD on our long silver and gold positions, which we hold physically. That said, the gold losses received some air cover from our short GLD call positions (1-3 months out, slightly OTM), which worked well.
In May, July, and August we went long Dec 22 WTI crude oil calls with strikes from $70 to $100. Those have been working very nicely so far.
We’re also long URA, the uranium ETF, as well as Dec 22 and Dec 23 futures on Eurostoxx 50 dividends. The latter we’re long since more than one year now.
Finally, in terms of volatility, we continue to hold a long strangle position in Eurostoxx 50 – a position which we may soon restrike to get closer to current spot levels. The position is well in-the-money.
We’re also long far-dated calls on Eurostoxx 50 and Nikkei, which are cheap not only from a volatility but also from a forward perspective, i.e., in backwardation, with expected dividends, repo, and negative rates all working in our favor.
We’re long VSTOXX and VIX Dec 21 futures. Not much to see there right now.
Last but not least, we’re long IVOL, an ETF through which we can get long exposure to long-dated rates volatility.
#happytrading


