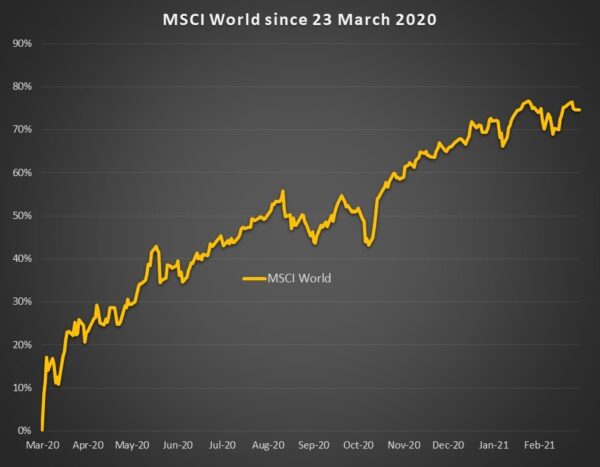
One year ago, on 23 March 2020, the S&P 500 closed at 2,237 index points. Today, it’s at 3,913 – an almost 75% increase in value.
Meanwhile, the Nasdaq 100 has rallied from a low of 7,000 to about 12,800 today, up 83%. In Europe, the Eurostoxx 50 is up 60%, and in Japan the Nikkei has risen about 78% from its low.
All of this happened in light of
- the worst global pandemic in over a century, causing more than 2.7 million deaths (and counting)
- the worst real GDP drop ever, down more than 30% annualized in the second quarter (and a fast recovery in the third quarter)
- a substantial increase in unemployment which (numbers are recovering but today’s level are still higher than pre-pandemic)
Against this backdrop we’ve seen a really amazing (and somewhat unexpected) rally in equities across the board. Is this the top for the stock market? Who knows. Looking at it from a trend following perspective, there’s no reason to exit. At least not yet. We want to stay long until we’re wrong, which is when our stop or exit is hit.
Equities aren’t the only show in town though. Sure, there’s bitcoin (and nothing comes even close), but let’s not forget about the commodities.
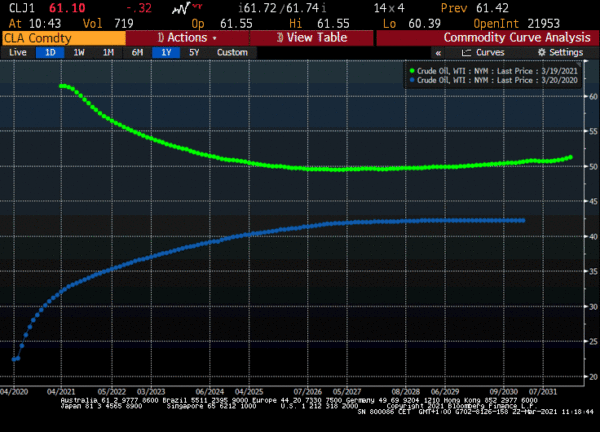
The May 2020 WTI crude oil contract traded at -37 USD last April. Two months prior, in February 2020, that same contract traded close to 60 USD. Nobody needed all that oil any more, and there wasn’t enough storage capacity available. Today, WTI is again trading around 60 USD. Quite a U-turn. Its futures curve has changed from a steep contango to a backwardation (see chart below).
The grains have performed exceptionally well, too. Wheat, corn, soybeans, soybean oil and meal – all of these have rallied strongly. And a similar picture can be seen in the base metals sector (especially iron ore and copper), as well as in sugar, cotton, and lumber.
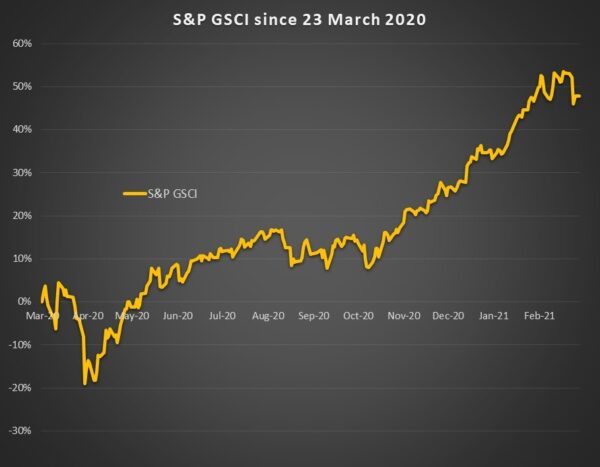
EUA emissions, one of our favorite markets as of late, have almost tripled compared to one year ago.
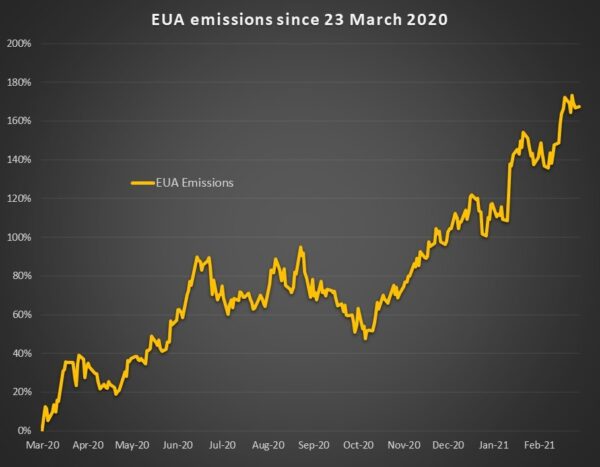
Where to from here? No idea. We’ll let the tape guide our way. Trend-wise, the 2Q Portfolio is short bonds and STIRs, long base metals, emissions, energies and grains, and long equities. In terms of currencies, the 2Q Portfolio is short the Yen vs. USD. It’s been a great 3-4 months for trend trading systems, but let’s see where the chips fall next.
#happytrading


