“Many a false step was made by standing still.” – Fortune Cookie
“Money never sleeps pal. I just made $800,000 in Hong Kong gold. It’s been wired to you – play with it. You done good, but you gotta keep doing good. I showed you how the game works, now school’s out.” – Gordon Gekko
Diversification is the only “free lunch” in finance
Whether you put your trust in Gordon Gekko (the inventor of “greed is good”) or an ancient Chinese proverb hidden in a Fortune Cookie, when it comes to financial markets, adapting to new circumstances, risk control, and exploring new opportunities is what keeps you alive. This is true for systematic trading strategies, too.
Most quantitative trading strategies, especially those with large AUM, tend to trade “standard” instruments (or markets, or assets) which generally are chosen by accessibility, liquidity, and correlation characteristics. These standard markets usually include USD-denominated equities, fixed income, currency and commodity futures, as well as their European and Asian counterparts. However, it’s easy to forget that those are only a subsection of the overall market universe, i.e., the total number of markets available to professional traders is much greater and includes markets such as power, freight, carbon emissions, equity dividends, OTC instruments such as interest rate swaps and swaptions, digital currencies, as well as highly liquid onshore Chinese commodity futures markets, to name just a few. And, because everything requires a label these days, somebody decided to label these non-standard markets “alternative” markets. Why? Most likely because some of them are still relatively young (e.g., digital currencies), or not as easily accessible and tradeable as the S&P 500, for example. That said, a dynamically changing basket of 500 US stocks (S&P 500) whose index committee first votes to keep Tesla out before making a U-turn a couple of weeks later to include it, is as alternative to us as corn, sugar, live cattle, bitcoin or freight. To us, a market is just that: a market. Period.
But what markets should one add to a portfolio, and how many? That’s an important question, but one that’s difficult to answer. We believe in diversification, and we want to gain as much from it as we possibly can. Viewed from that perspective we’d add as many markets as possible, but we also need to put the marginal value of each addition in context. Will the incremental diversification benefit outweigh the incremental transaction costs, and will the added market have a meaningful impact on the portfolio given the total market liquidity/capacity available?
There are clear advantages to combining imperfectly correlated assets in a portfolio, but those benefits do not extend equally to every new market. For equities, the extra diversification gained by adding another equity index market to a portfolio which already contains other equity index markets from the same region tends to be very little. S&P 500 e-mini futures trade a daily value of approximately $140 billion, which is more than 10 times greater than the daily trading value of Dow Jones Industrial Average (DJIA) futures, which is roughly $10 billion. The correlation between both is about 0.97, and hence not much can be gained by adding the less liquid DJIA to a portfolio which already trades the S&P 500.
In recent years, many trend following CTAs have ventured into alternative markets to increase the diversification characteristics of their portfolios. According to HedgeNordic, Systematica, for example, is trading over 270 OTC markets such as forwards, emerging market FX, equity sector swaps, interest rate swaps, commodity swaps and commodities such as iron ore, coal and electricity. Again, it’s unclear to us why iron ore and electricity are considered “alternative” while live cattle and cocoa are not, but the market also calls funds which generally do not hedge, well, hedge funds.
Another example is Florin Court Capital, led by Doug Greenig, who you might know from the Top Traders Unplugged Episode 108, where he discussed the approach of including non-standard markets in his trend following program.
While we still regret the absence of tea futures from international markets (which has its own specific reasons, as pointed out in a previous blog post), there are a number of really interesting markets in…

Let’s now have a look at the correlations between the Chinese futures markets* and some of their Western equivalents (WTI crude oil, natural gas, live cattle, wheat, corn etc.). Correlations range from slightly negatively correlated (purple) to highly correlated (yellow). The cyan rectangle highlights all the Chinese commodity futures and their correlations to each other. There are some relatively high correlations between assets which are based on the same commodity (e.g. soy-based products) or among asset classes with similar driving factors (e.g. precious metals, industrial metals). The same is true for the Western commodities highlighted in the red rectangle. The first three columns in this rectangle (gold, crude oil and natural gas) are barely correlated to the remaining commodities in the group, while the Western agricultural commodities show varying degrees of correlation between each other.
We now consider the correlations between the Chinese commodity futures and Western commodities, highlighted by the two green rectangles. It’s an ocean of purple, meaning there is not a lot of correlation. In fact, correlations of above 0.4 are only observable for precious metals (highlighted) while the remaining assets show correlations that fluctuate around zero most of the time.
While this is only a first and very simple look at the correlation structure (for greater detail we’d have to look at the stability and behavior over time), the results suggest that one should expect a substantial diversification benefits when adding these Chinese contracts to a portfolio that predominantly includes standard markets.

You may be tempted to say: “OK, nice and uncorrelated, but who is actually trading these things? Eggs, ferrosilicon, and glass? Come on! Volumes must be tiny.”
Far from it.
We now look at the average trading volume of the Chinese futures markets compared to Western commodity markets in 2018/2019: Just looking at agricultural commodity volumes makes my feet shaky. China (in blue) is truly dominating that field.
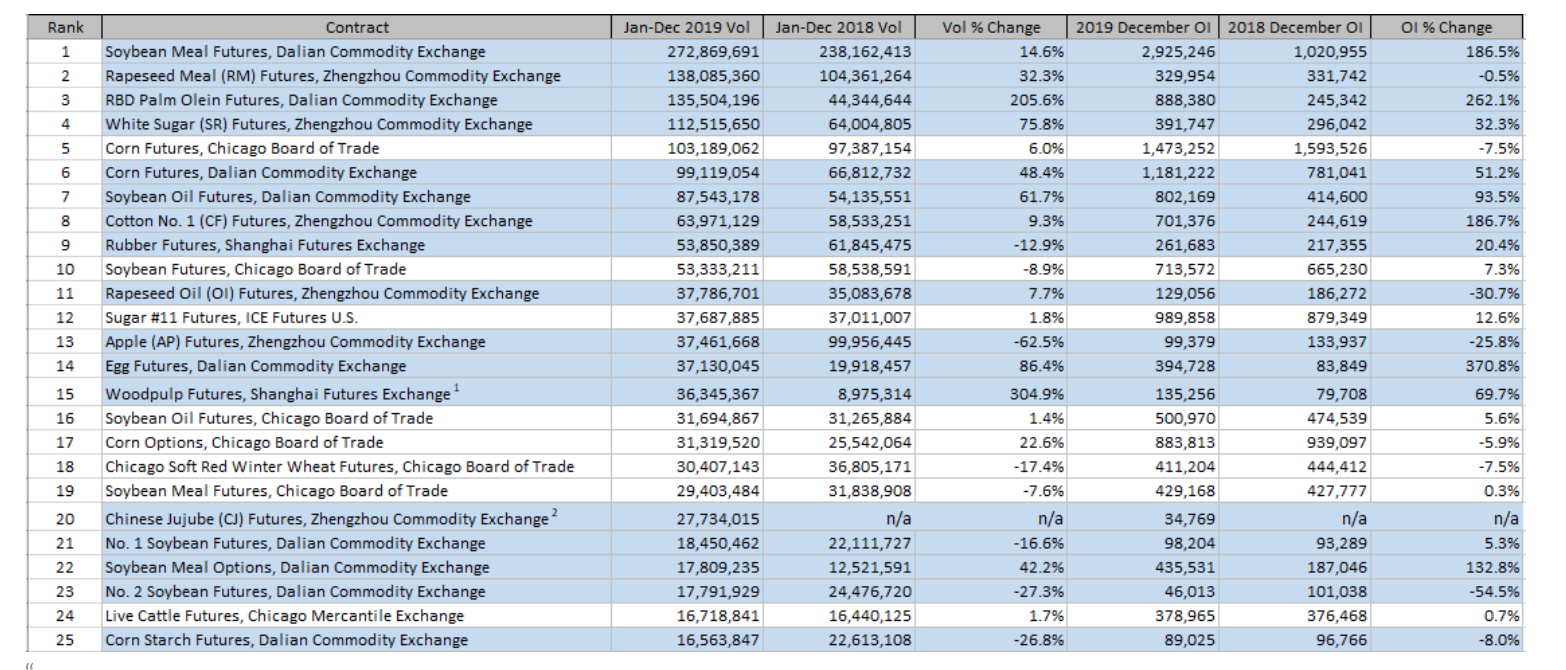
Source: RCM Alternatives
If you’d like to have a more detailed view, we recommend you have a look at this blog post by RCM Alternatives who are active in China via their China Opportunities Fund.
And if you think these markets are not for you because they are only available to onshore traders, think again. Some of them can be accessed from overseas (rubber, crude oil, iron ore, PTA), and the Shanghai-based INE is about to launch an international copper futures contract.
Shanghai INE will launch RMB-denominated copper futures. Those will be accessible to overseas investors. https://t.co/nZf7t5CMbE
— Moritz Seibert (@moritzseibert) November 18, 2020
To make you more accustomed to Chinese commodity futures markets, we’ll give you an introduction to commodities trading in China in part 2 of this blog post. Last but not least, in part 3, we’ll focus on one market we’re particularly curious about and provide some useful advice for trading cost assumptions in Chinese commodity futures.
*If you are interested in market data for Chinese commodity futures, you can get some for free at Quandl.
#happytrading